When logging in to TIM Enterprise, the following dashboard screen is displayed:
The information you see on this screen is relevant only to the area to which you've been granted access. For example:
|
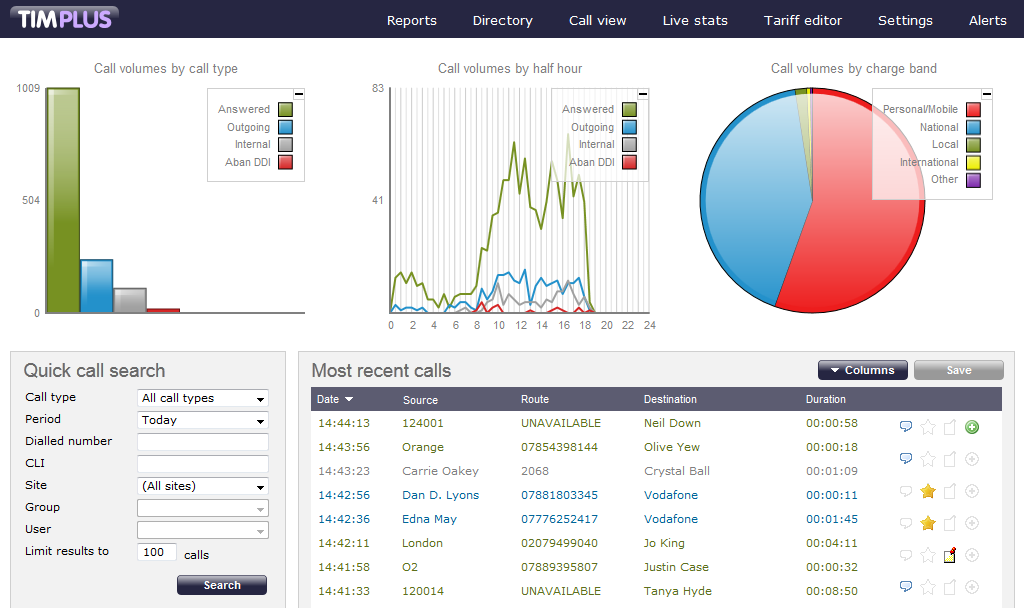
The dashboard screen consists of a toolbar along the top of the page and three main panels.
The toolbar is the main menu that you use to navigate the major features of TIM Enterprise. The tabs that make up the toolbar differ according to the type of account you use to log in with. The screenshot above displays an example dashboard screen for a user account that has administrative privileges whereby all of the tabs are present; however, for a restricted web user account, some of the tabs might not be visible, such as or .
The three panels that make up the dashboard screen are as follows:
After successfully logging in, the following Dashboard screen will be displayed. All of the information you see on this screen is relevant only to the area to which you've been granted access.
For example, if you are a site administrator, the graphs, live call view, and any other call-related information will be derived only from calls that happened on your own site, but not those from any other sites that the system may be configured to log.
Similarly, if your login is that of a user group (department) manager, the management information you see will represent only those calls that are related to users within your group.
This screen shows the most recent calls output. Calls will scroll down the screen with the most recent at the top as demonstrated below:

The dashboard consists of a Function bar and three main panels. The tabs on the Function bar may vary depending on your access level e.g. users with restricted access may not be able to view the tab. The panels are as follows:-
The next sections describe these in more detail.