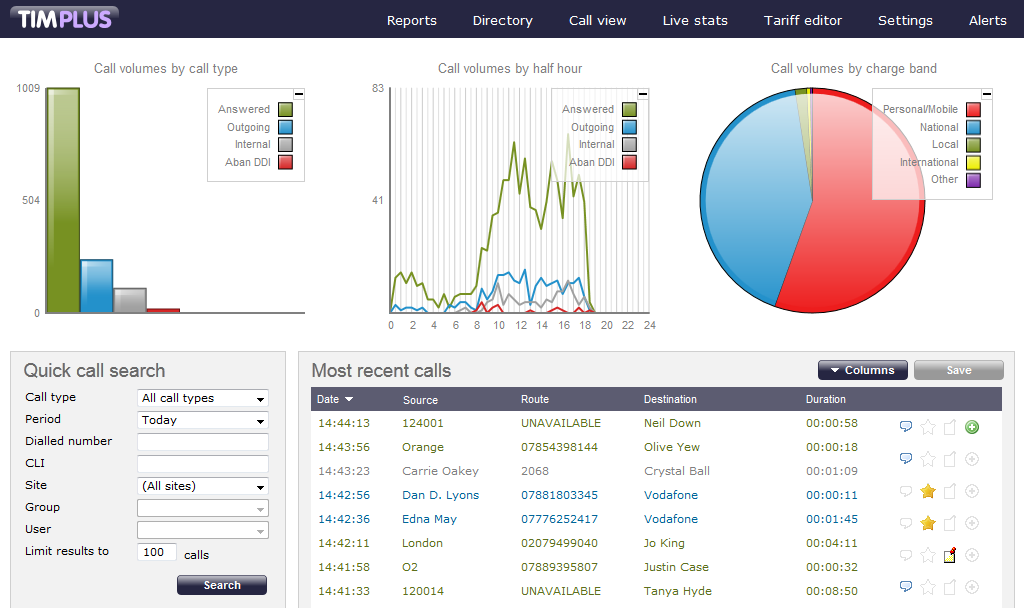
When logging in to TIM Plus, the following dashboard screen is displayed:
The information you see on this screen is relevant only to the area to which you've been granted access. For example:
|
The dashboard screen consists of a toolbar along the top of the page and three main panels.
The toolbar is the main menu that you use to navigate the major features of TIM Plus. The tabs that make up the toolbar differ according to the type of account you use to log in with. The screenshot above displays an example dashboard screen for a user account that has administrative privileges whereby all of the tabs are present; however, for a restricted web user account, some of the tabs might not be visible, such as or .
The three panels that make up the dashboard screen are as follows: