The report will open in a browser window, which can be panned around using the horizontal and vertical scrollbars. If the report is made up of multiple pages, you can navigate it using the  and
and  buttons.
You can print the report or save it as an HTML file by clicking on the or button at the bottom of the screen. When you've finished viewing the report, click on the button.
Each report has its own selection criteria and output (charts, graphs and tables), which will be described individually in the Report types section.
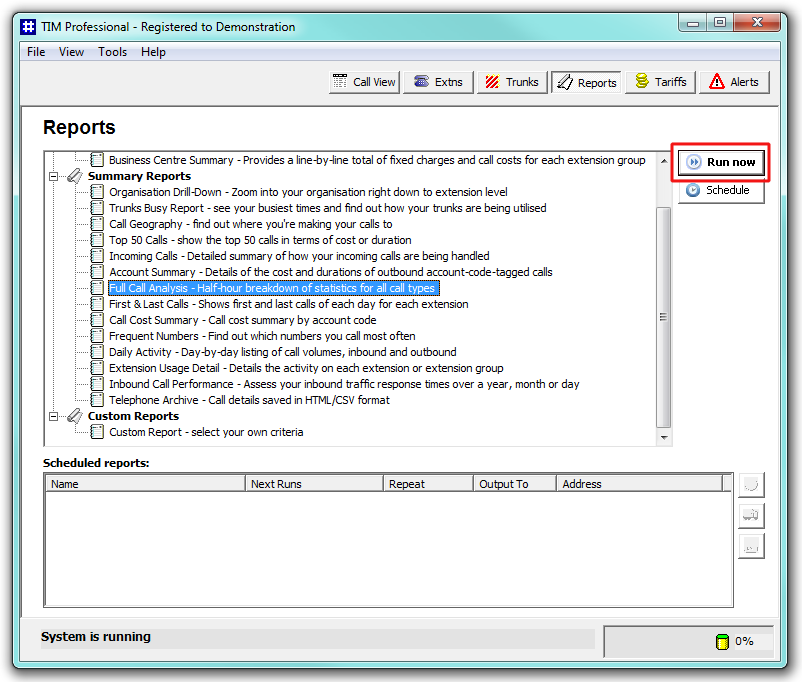
To run a report, simply select the report you'd like to run from the report list, then click
on the  button. Alternatively, you can double-click on your desired
report.
button. Alternatively, you can double-click on your desired
report.

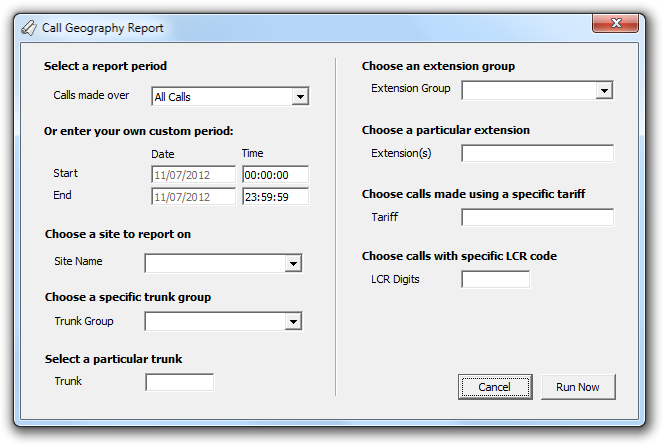
Depending on which report you selected, its Report Selection Criteria window will be displayed, where you can select the period and criteria for the report. The example below shows the Report Selection Criteria window of Call Geography report.

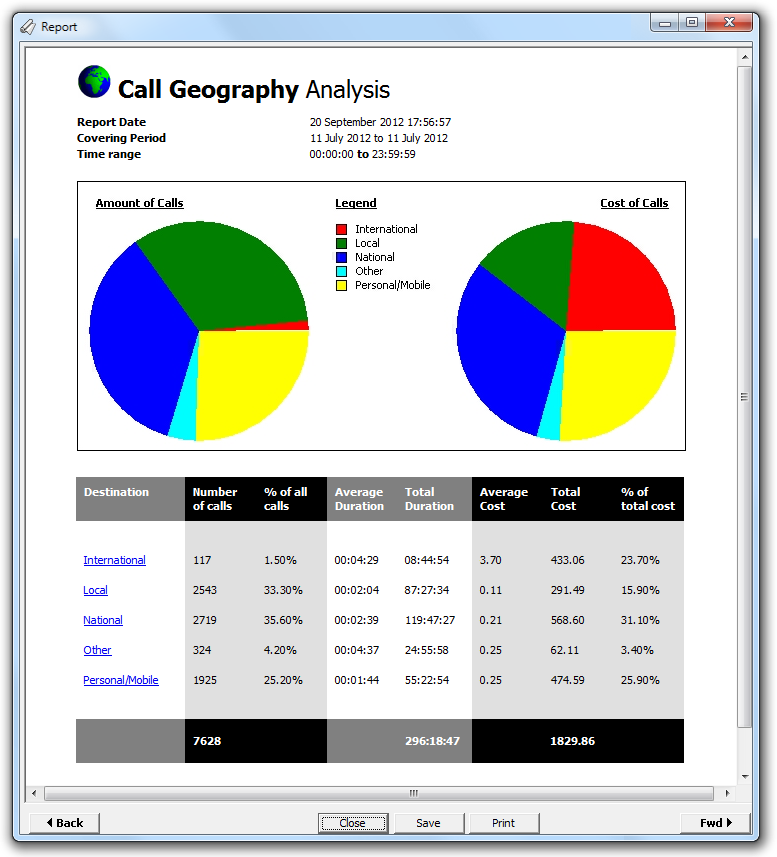
Pressing the button will begin running the report. The status bar will show that the report is being calculated, after which it will be displayed in the Report Output window. The example below is the output from a Call Geography report:

It is the common interface for all reports. The report body is shown in a window
which can be panned around by using the horizontal and vertical
scrollbars. If the report is made up of multiple pages, you can
navigate it by using the  and
and  buttons at the
bottom. You can print the report by pressing the
button, or save the report to an HTML file by pressing the
button.
buttons at the
bottom. You can print the report by pressing the
button, or save the report to an HTML file by pressing the
button.
When you've finished viewing the report, press the button.
Each report has its own selection criteria and output (charts, graphs and tables) and these are described in detail for each one, in the next pages.