Introduction
The Trunk Busy report allows you to break down each business day into half-hour periods, showing the maximum and average number of telephone lines in use for each half-hour period. This report is useful for determining whether or not you have enough lines or if you have too many.
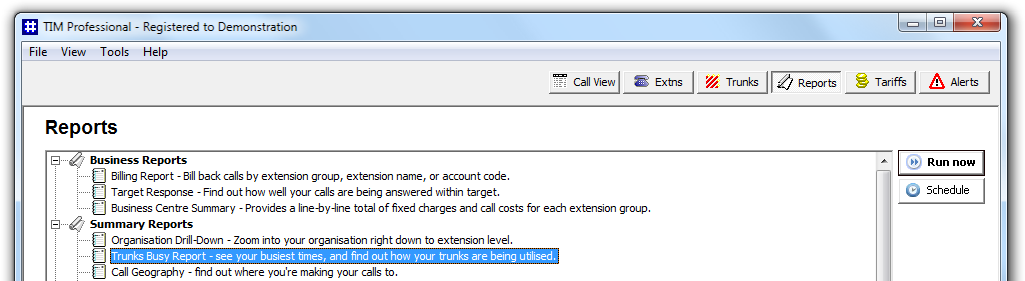
Running the report
Access the Reports screen, select the Trunk Busy report from the list and click on the button.
A new window will open, allowing you to configure the parameters of your report:
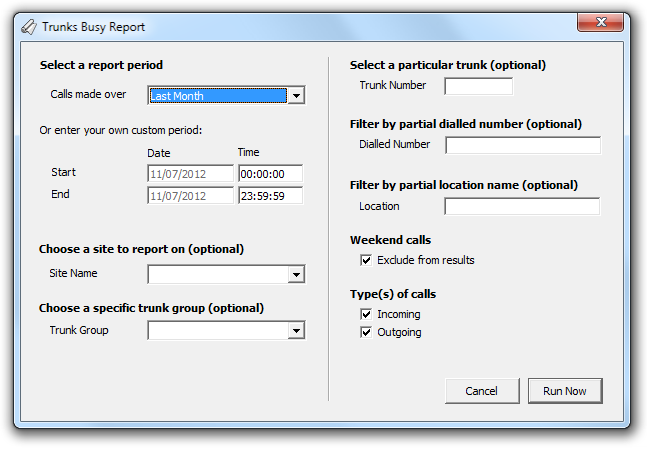
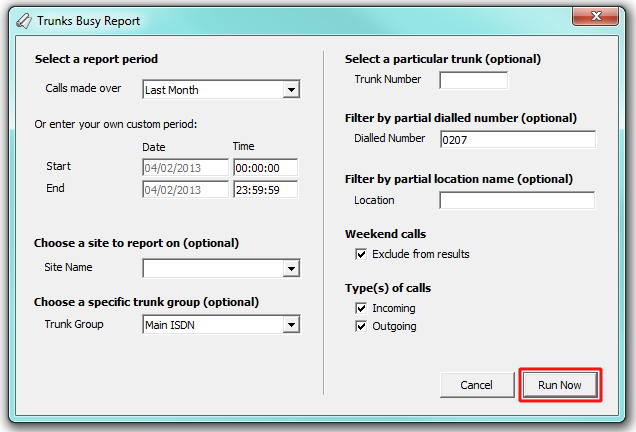
Select a report period
For each report, you must specify a time span that covers the calls you want the report to include.
There are several preset reporting periods available for selection, based on the standard Gregorian calendar. The following table describes how the start and end times are defined for each preset period:
| Period | Description |
|---|---|
| Today | The start and end dates are set to the current date. The start time is set to 00:00:00 and the end time to 23:59:59. |
| Yesterday | The start and end dates are set to the current date minus one day. The start time is set to 00:00:00 and the end time to 23:59:59. |
| This week | The start date is set to the first day (normally Monday) of the current week. The end date is set to the current day. The start time is set to 00:00:00 and the end time to the current time. |
| Last week | The start date is set to the date of the last Monday, and the end date is set to the start date plus seven days. The start time is set to 00:00:00 and the end time to 23:59:59. |
| This month | The start date is set to the first day of the current month. The end date is set to the current day. The start time is set to 00:00:00 and the end time to the current time. |
| Last month | The start date for this period is set in three stages: The day is set to the first day of the month. The month is set to the previous month. The year is set to the current year, unless it is currently January, in which case, the previous year is used. The start and end times are set to 00:00:00 and 23:59:59 respectively. |
| This year | The start date is set to the first day of the first month of the current year, whilst the end date is set to today's date. The start and end times are set to 00:00:00 and 23:59:59 respectively. |
| All calls | The start and end dates and times are set to the dates and times of the first and last call in the entire call database, respectively. |
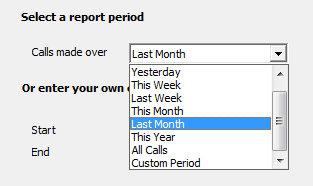
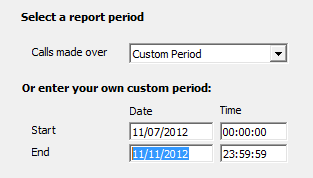
In addition to the presets described above, it is possible to specify a custom reporting period by choosing Custom period from the drop-down list and specifying your own Start and End dates, as shown below:
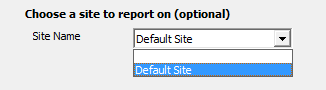
Choose a site to report on (optional)
If your system is set up to log multiple sites, you can select a particular site from the drop-down list. To report on all sites, select the blank line.
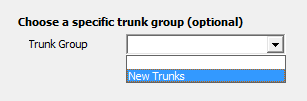
Choose a specific trunk group (optional)
To run the report on a specific trunk group, select it from the drop-down list. To report on all trunks, select the blank line.
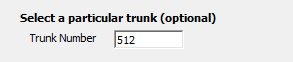
Select a particular trunk (optional)
To report on a particular trunk, enter the trunk number in the box provided.
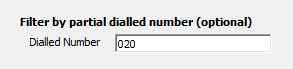
Filter by partial dialled number (optional)
To report on a specific dialled number, enter the partial or full number in the field provided. The number you enter can include wildcards, e.g. 0118*
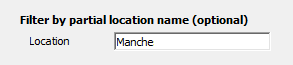
Filter by partial location name
To report on calls to a specific location, enter its full or partial name in the field provided.
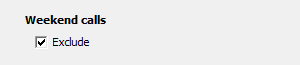
Weekend calls
Calls made at weekends may distort the result of the report. To exclude such calls, tick the Exclude box, as shown below:
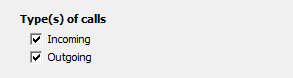
Type(s) of call
This option allows you to define the type of call you want to report on, e.g. incoming, outgoing. To report on a specific type of call, tick the appropriate box.
Creating the report
When you have selected a reporting period and have chosen the report's criteria, click on the button, as shown below:
The report's results
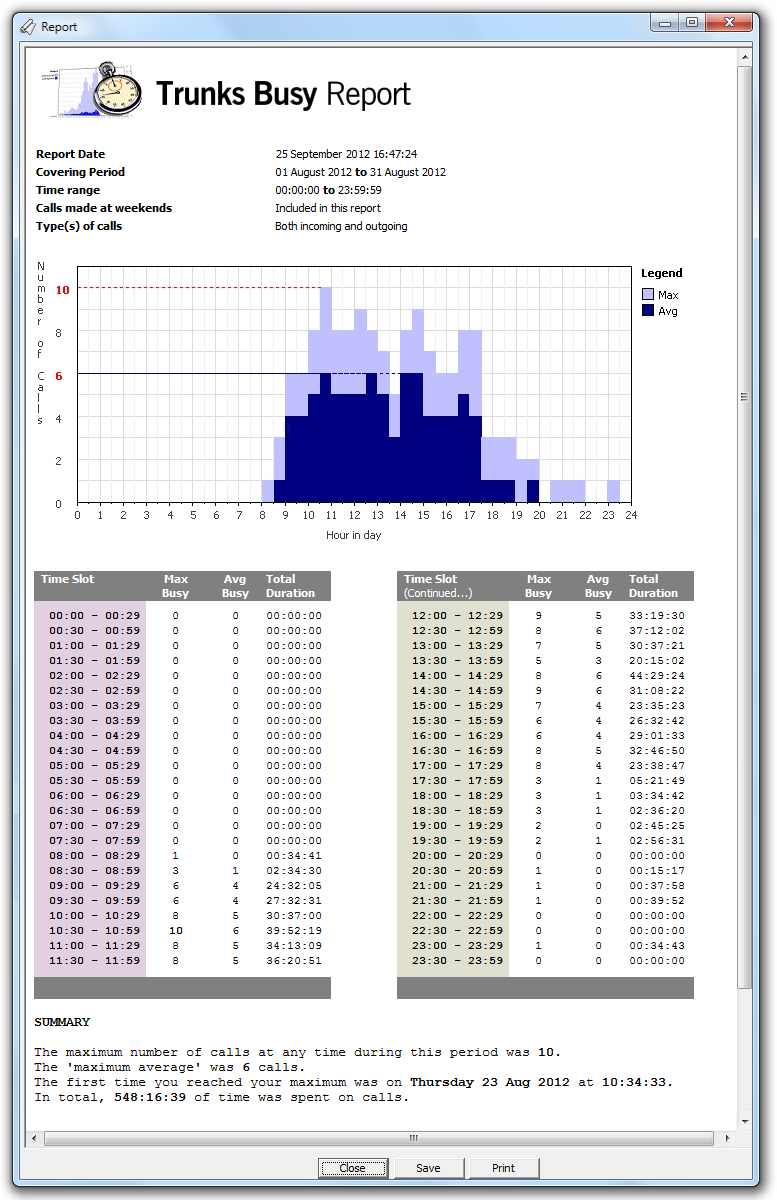
Below is an example of this report's output:
The header of the report will display its title, any friendly name you assigned to it, the period of the report and any options you have selected in the report's selection criteria window.
The body of the report consists of a graph and a table:
- The graph is a quick and easy indication of your line usage, broken down into half-hour time slots. The percentage on the y-axis shows the number of lines utilised, and the x-axis shows each half-hour of the day. The bars on the graph coloured light-purple show the maximum number of busy trunks in each particular half-hour, and the overlaid dark-purple ones show the average number of busy trunks in the same time period.
- The table displays the actual data organised in columns for maximum and average busy lines and the total duration for each half-hour time slot. Each column header of the table is described below:
| Header | Description |
|---|---|
| Time slot | The time of day in half-hour periods |
| Max busy | The maximum number of trunks in use during the time slot shown |
| Average busy | The average number of trunks in use during the time slot shown |
| Total duration | The total duration of all calls made or received within the time slot shown |