Inbound Call Performance
Introduction
The Inbound Call Performance report displays how quickly your inbound calls are being answered, compared to your target thresholds, grouped by year, month, day or hour. This report is ideal for organisations where seasonal fluctuations in call traffic occur.
Running the report
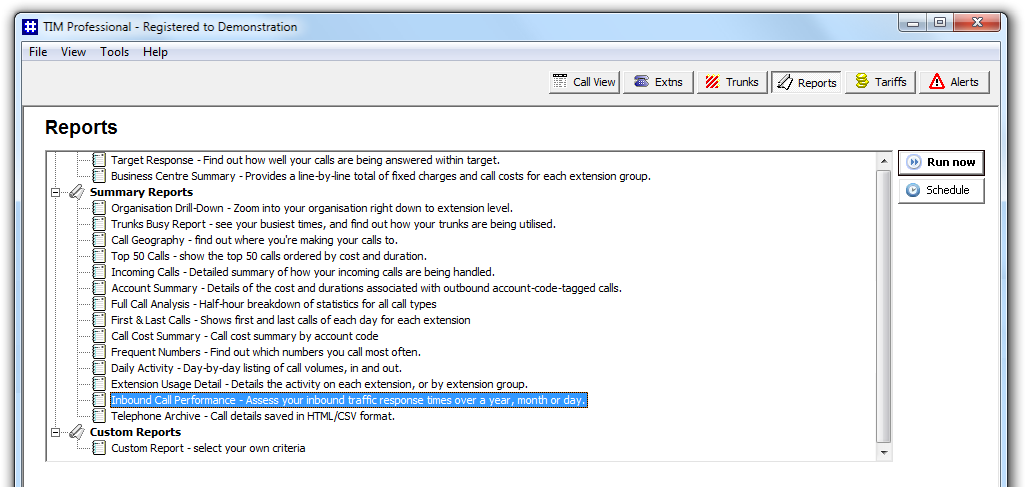
Access the Reports screen, select the Inbound Call Performance report from the list and click on the button.
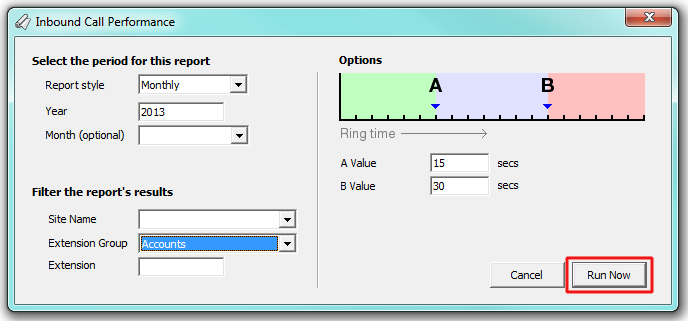
A new window will open, allowing you to configure the parameters of your report:
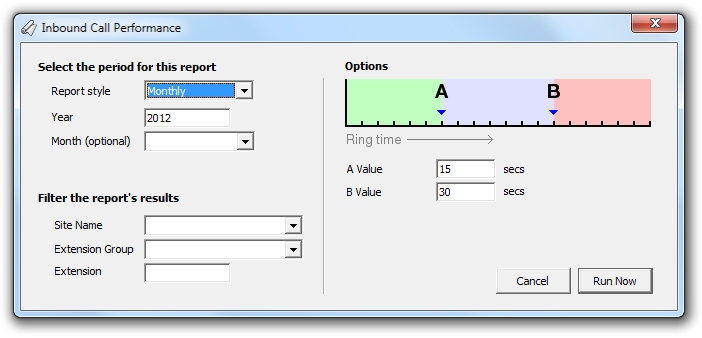
Select the period for this report
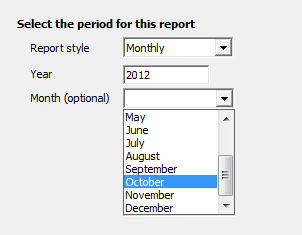
For each report, you must specify a time span that covers the calls you want the report to include. The default reporting period is set to every month of the current year. To specify a different time period, you can enter a different year or select a particular month from the drop-down menu, as shown below:
Filter the report's results
If your system is set up to log multiple sites, you can select a particular site from the drop-down list. To report on all sites, select the blank line.
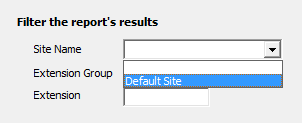
To monitor the call activity for a specific department, select an extension group from the drop-down list, or to report on a single extension, enter the details in the box provided, as shown below:
You can also choose to report on a single extension by entering the extension number in the box provided. To report on all extensions, leave the box blank to include information from across your entire organisation.
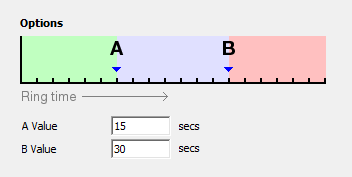
Options
To define your response target threshold(s) enter the values in the A Value and B Value fields. The example below shows response time targets for calls answered below 15 seconds, 15-30 seconds and above 30 seconds.
Creating the report
When you have selected a reporting period and have chosen the report's criteria, click on the button, as shown below:
The report's results
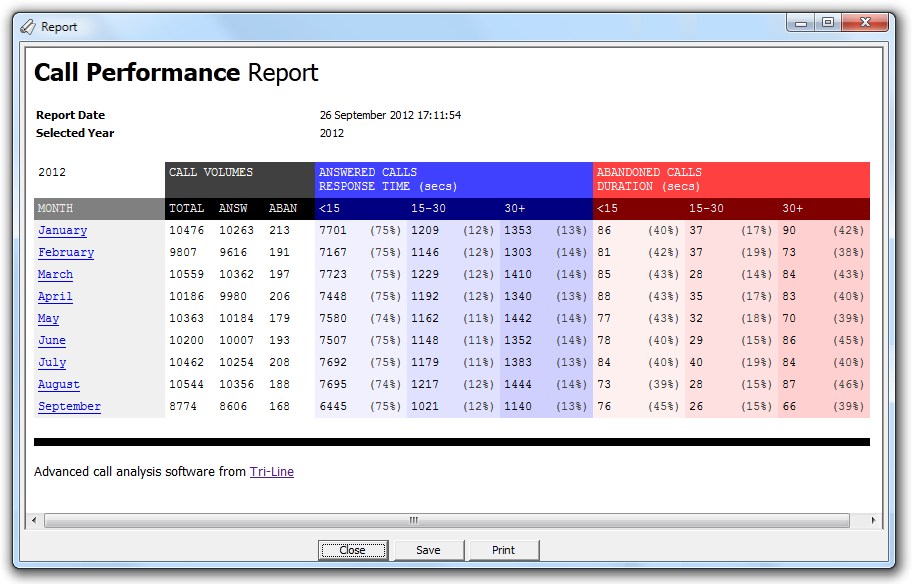
Below is an example of this report's output:
The header of the report will display its title, any friendly name you assigned to it, the period of the report and any options you have selected in the report's selection criteria window.
The body of the report consists of a table showing a summary of call volumes, answered calls and abandoned calls, broken down by the target thresholds you have selected. Each period is shown as a hyperlink which, if clicked on, allows you to see the same summary information for a more granular period, or a fully itemised list of all calls on each day and for each half-hour time slot.
The summary information is displayed in a table containing the following information:
| Column header | Description |
|---|---|
| Month/day/timeslot | The time period of the report |
| Call Volumes | |
| Column header | Description |
| Total | The total number of calls in each period |
| Answered | The number of answered calls in each period |
| Abandoned | The number of abandoned calls in each period |
| Answered Calls* | |
| Column header | Description |
| <15 | The number and the percentage of calls answered in less than 15 seconds |
| 15-30 | The number and the percentage of calls answered within 15 and 30 seconds |
| 30+ | The number and the percentage of calls answered in more than 30 seconds |
| Abandoned Calls* | |
| Column header | Description |
| <15 | The number and the percentage of abandoned calls that rang for less than 15 seconds |
| 15-30 | The number and the percentage of abandoned calls that rang between 15 and 30 seconds |
| 30+ | The number and the percentage of abandoned calls that rang for more than 30 seconds |
The report will display the number and the percentage of calls according to the target threshold(s) set in the report's selection criteria window. |