Call Geography
Introduction
The Call Geography report consists of two pie charts, showing call information grouped by volume and cost. An accompanying table is also shown, containing details of where - geographically - your calls are made, classified by their tariff band, such as local, national, mobile or international.
The proportion of calls to each geographical destination is shown in terms of volume, duration and cost, highlighting the calls that are costing you the most and taking up most of your time.
Running the report
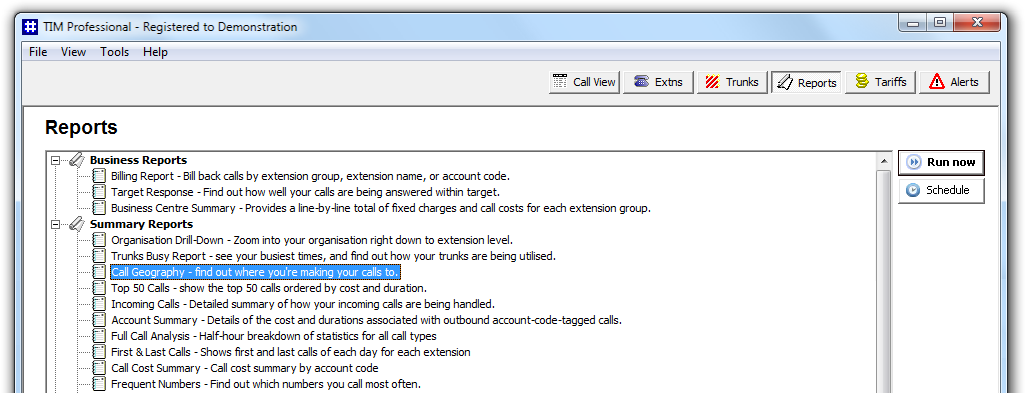
Access the Reports screen, select the Call Geography report from the list and click on the button.
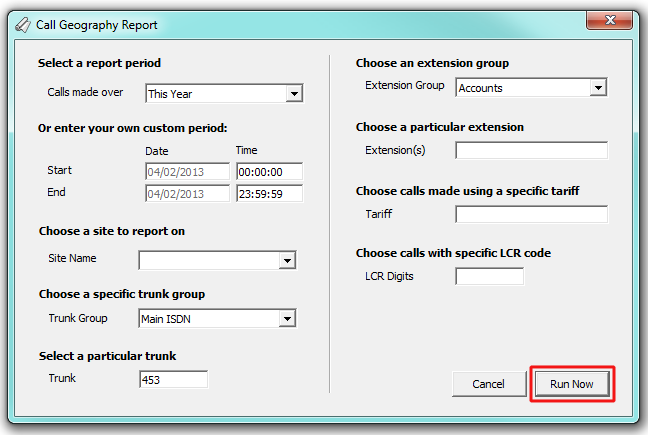
A new window will open, allowing you to configure the parameters of your report:

Select a report period
For each report, you must specify a time span that covers the calls you want the report to include.
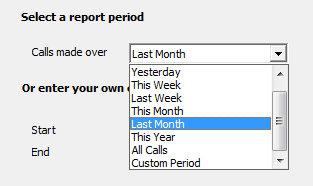
There are several preset reporting periods available for selection, based on the standard Gregorian calendar. The following table describes how the start and end times are defined for each preset period:
| Period | Description |
|---|---|
| Today | The start and end dates are set to the current date. The start time is set to 00:00:00 and the end time to 23:59:59. |
| Yesterday | The start and end dates are set to the current date minus one day. The start time is set to 00:00:00 and the end time to 23:59:59. |
| This week | The start date is set to the first day (normally Monday) of the current week. The end date is set to the current day. The start time is set to 00:00:00 and the end time to the current time. |
| Last week | The start date is set to the date of the last Monday, and the end date is set to the start date plus seven days. The start time is set to 00:00:00 and the end time to 23:59:59. |
| This month | The start date is set to the first day of the current month. The end date is set to the current day. The start time is set to 00:00:00 and the end time to the current time. |
| Last month | The start date for this period is set in three stages: The day is set to the first day of the month. The month is set to the previous month. The year is set to the current year, unless it is currently January, in which case, the previous year is used. The start and end times are set to 00:00:00 and 23:59:59 respectively. |
| This year | The start date is set to the first day of the first month of the current year, whilst the end date is set to today's date. The start and end times are set to 00:00:00 and 23:59:59 respectively. |
| All calls | The start and end dates and times are set to the dates and times of the first and last call in the entire call database, respectively. |
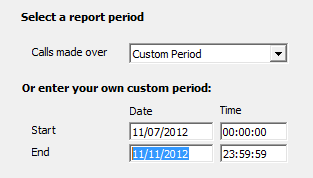
In addition to the presets described above, it is possible to specify a custom reporting period by choosing Custom period from the drop-down list and specifying your own Start and End dates, as shown below:
Choose a site
If your system is set up to log multiple sites, you can select a particular site from the drop-down list. To report on all sites, select the blank line.
Choose a specific trunk group
To run the report on a specific trunk group, select it from the drop-down list. To report on all trunks, select the blank line.
Select a particular trunk
To report on a particular trunk, enter the trunk number in the box provided.

Choose an extension group
To monitor the call activity for a specific department, select an extension group from the drop-down list. To report on all extension groups, select the blank line.
Choose a particular extension
You can choose to report on a single extension or a range of extensions, by entering the details in the box provided, as shown below:
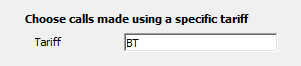
Choose calls made using a specific tariff
If you are using more than one tariff table to cost calls, enter the name of the tariff you want to report on in the box provided.
Choose calls with specific LCR code
To report on calls that are routed indirectly through a particular carrier, enter the carrier's prefix in the box provided, e.g. enter 1452 for Access Eurobell

Creating the report
When you have selected a reporting period and have chosen the report's criteria, click on the button, as shown below:
The report's results
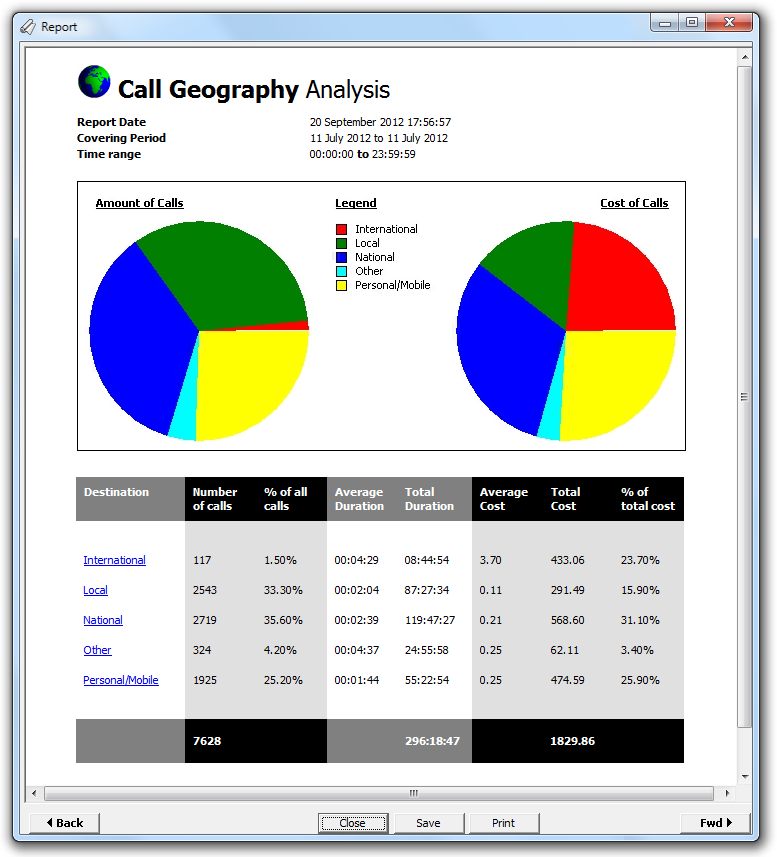
An example of this report's output is shown below:
The header of the report will display its title, any friendly name you assigned to it, the period of the report and any options you have selected in the report's selection criteria window.
The body of the report will display two pie charts and a table.
| Report elements | Description |
|---|---|
| Chart | The left-hand pie chart shows the amount of calls to various destinations, whilst the right-hand chart shows the cost of calls to each destination. The legend in the centre allows you to quickly identify the destination type. |
| Table | This shows in detail the amount of calls made to those specific destination, expressed as a percentage of all calls, along with the average, total and percentage costs associated with each destination. |
The summary line at the foot of the table shows the total number of calls included in the report, the total duration of calls, average and total costs.