Overview
The Target Response report enables you to assess how well calls to your company are answered, compared to user-defined targets. The report provides a visual representation as well as a line-by-line summary of the proportion of calls answered inside and outside your set targets.
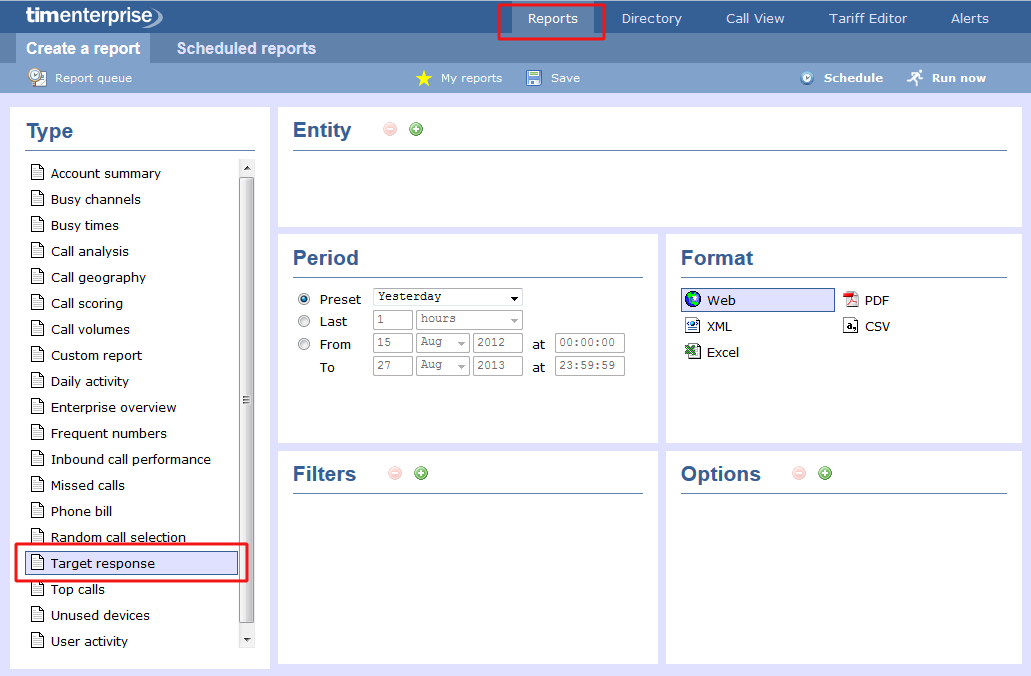
Running the report
Click on the Reports tab and select Target response from the left-hand pane. The screen displaying the parameters of the report will appear, where you can configure the entity, period, filters, options and format of the report.
For details about how to configure these parameters, refer to the relevant page(s) in the list below:
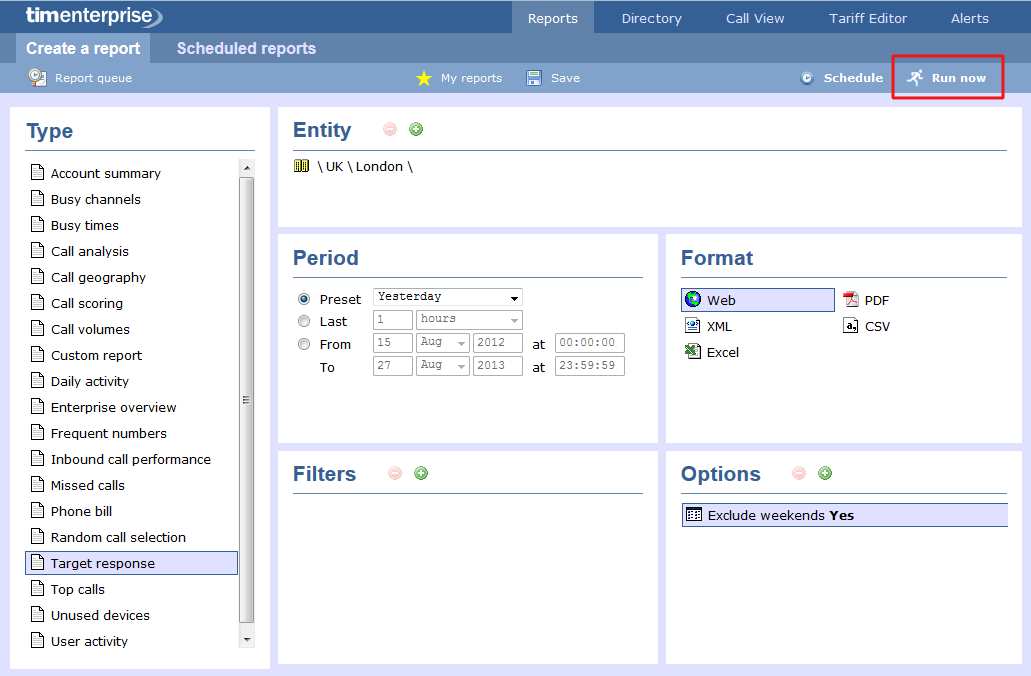
Creating the report
When you have configured the report's parameters, click on the button to run the report immediately; alternatively, you can save the report's definition or schedule the report for future delivery.
The report's results
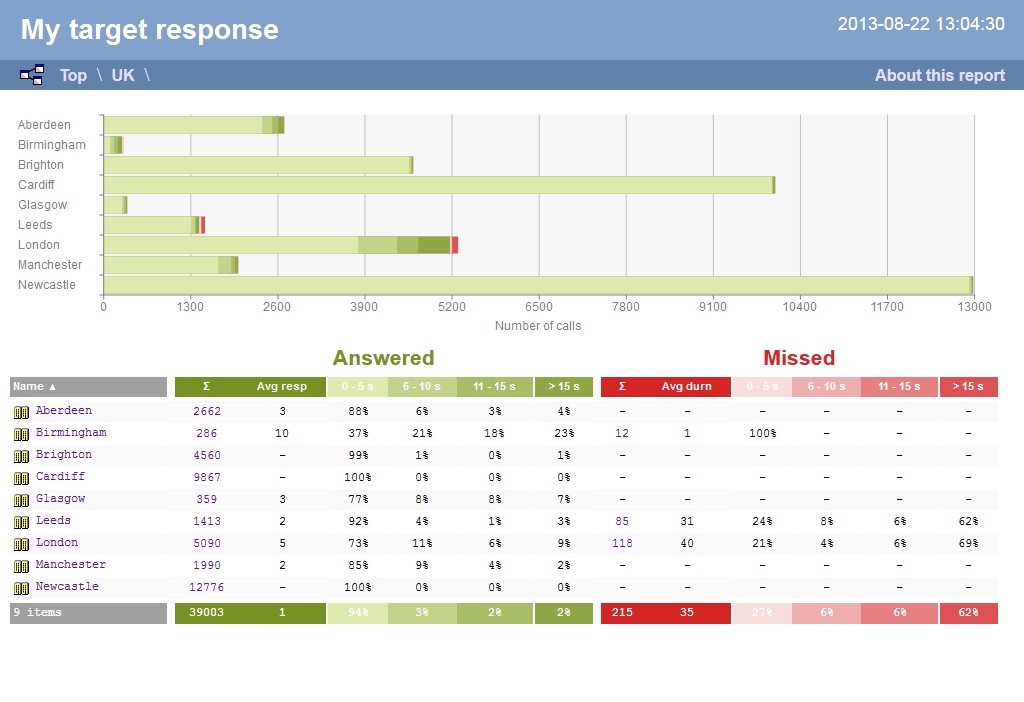
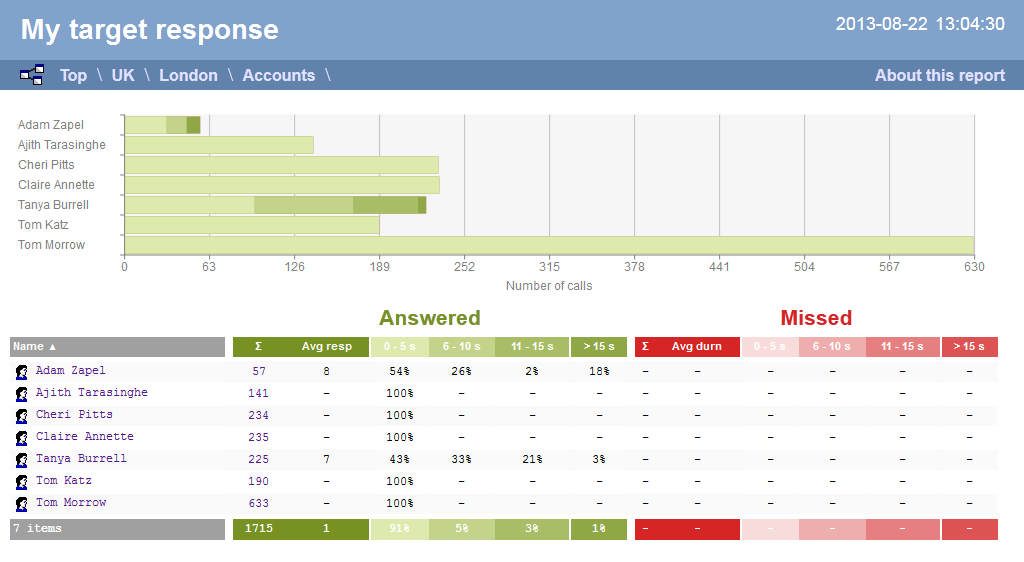
Below is an example of this report's output in Web format. By clicking on the About this report link at the top-right corner of the page, you can review any filters and options that have been applied to the report.
As with all reports produced by TIM Enterprise, each page of the report includes the following information:
- the report's title
- the date and time that the report was generated
- the name of the report, if applicable
The Web format is the most interactive of all formats: all column headers are click-sortable and most graphical and tabular elements can be drilled down into, allowing deeper analysis of your results.
The body of the report consists of a table showing a summary of call information for the period you selected, grouped by entity. Each column header of the table is described below:
| Header | Description |
|---|---|
| Name | The name of the entity for each line of data |
Answered |
|
Missed |
|
 : The total volume of calls received for each entity
Each entity is shown as a hyperlink which, if clicked on, re-runs the report to include only call information pertaining to that entity, allowing you to inspect the performance of specific teams and individual users.
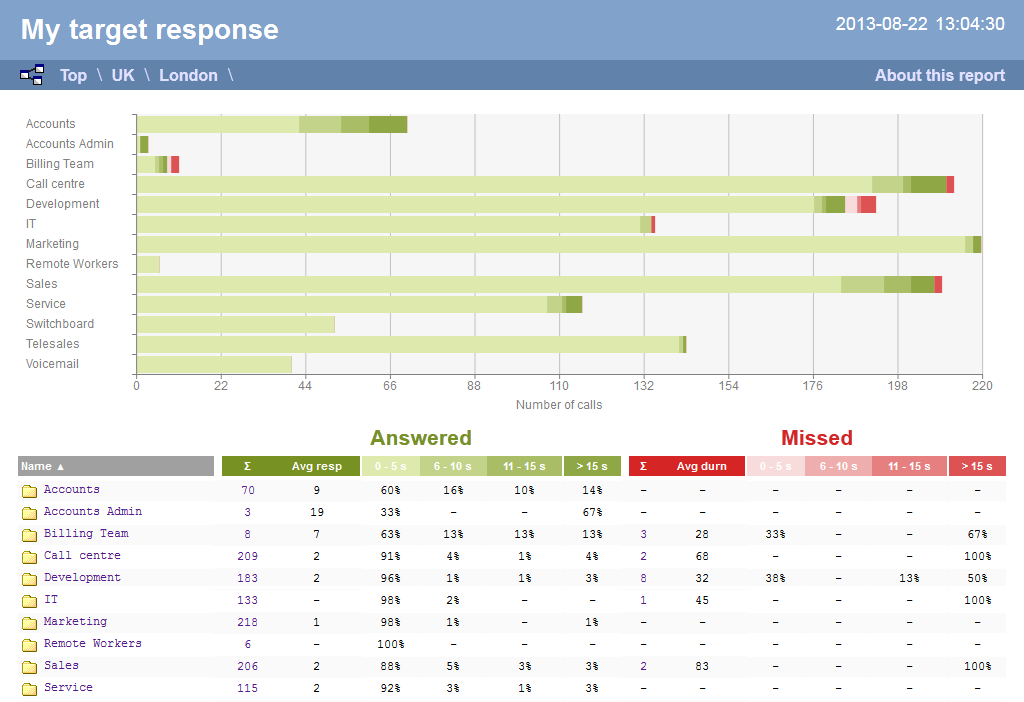
To modify your report to cover a larger organisational scope, click on an element of the breadcrumb as shown below:
