The summary graphs panel consists of three separate graphs, each organising their information using different criteria, as described below:
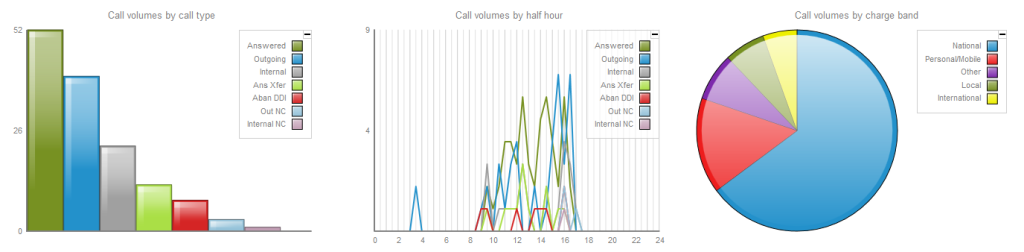
The information you see in each graph pertains only to the area which the logged-in user has been granted access to. |
Call volume by call type
This first graph shows a snapshot of calls for the current day, based on the type of call, e.g. inbound, outbound, missed.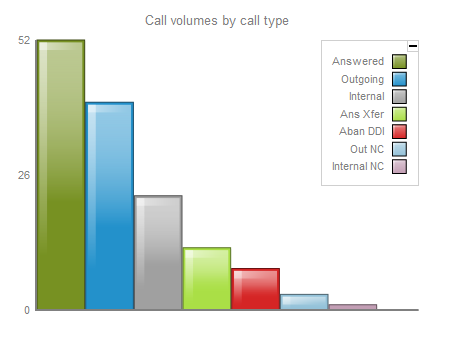
Each call type in the graph is colour-coded as follows:
- Green: Incoming calls
- Light green: Answered transferred calls
- Blue: Outgoing calls
- Light blue: Outgoing non-connected calls
- Grey: Internal calls
- Mauve: Internal non-connected calls
- Red: Abandoned DDI (Direct Dialled In) calls
- Pink: Tandem calls
Call volume by half hour
This graph shows a snapshot of calls for the current day, broken down by half-hour, allowing you to quickly identify peaks and troughs in call volumes to identify busy periods.
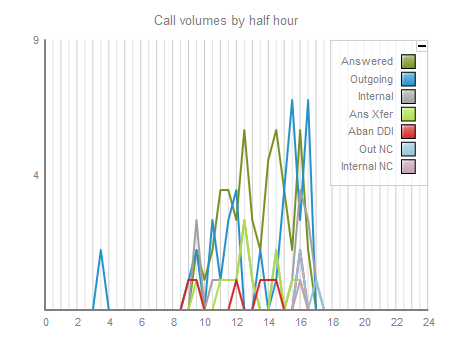
Each call type is colour-coded as follows:
- Green: Incoming calls
- Light green: Answered transferred calls
- Blue: Outgoing calls
- Light blue: Outgoing non-connected calls
- Grey: Internal calls
- Mauve: Internal non-connected calls
- Red: Abandoned DDI (Direct Dialled In) calls
- Pink: Tandem calls
The same call type colour scheme applies throughout TIM Enterprise. |
Call volume by charge band
This graph shows a snapshot of calls for the current day, based on their destination, allowing you to identify where you call most often. Calls are grouped into geographical locations such as Mobile, National, Local, International etc.
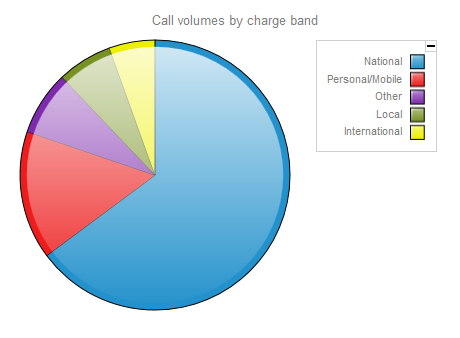
By default, the following colour scheme is used to identify calls to each geographical group:
- Red: Personal/Mobile calls
- Green: Local calls
- Blue: National calls
- Yellow: International calls
- Purple: Other calls