Overview
The Inbound Call Performance report displays how quickly your inbound calls are being answered, compared to your target thresholds, grouped by year, month, day or hour. A visual representation of how well each target is met is shown alongside a table containing the actual response time values.
Running the report
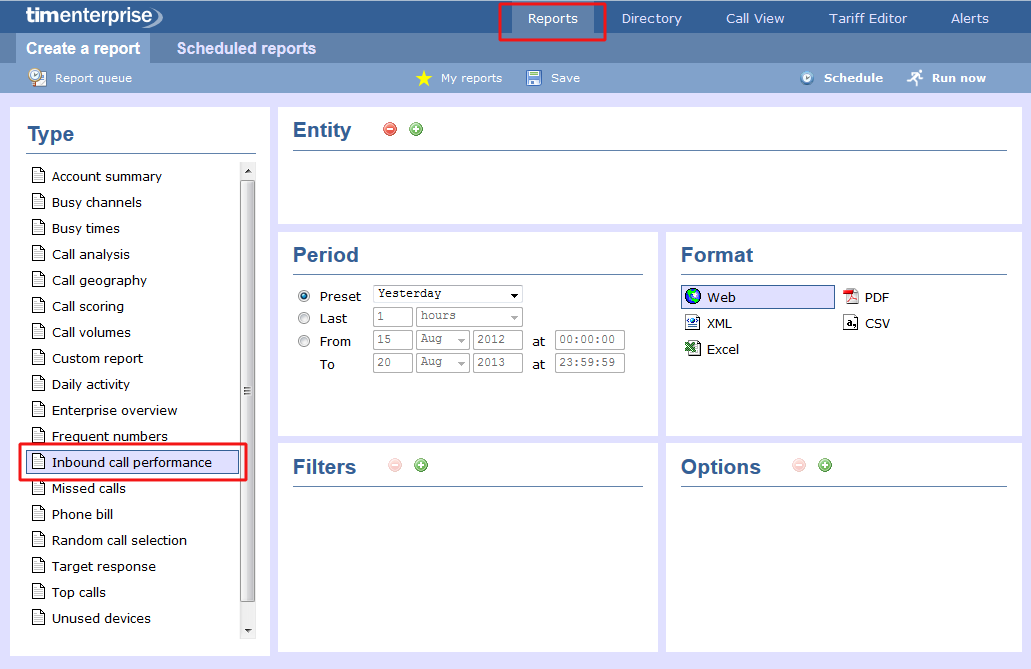
Click on the Reports tab and select Inbound call performance from the left-hand pane. The screen displaying the parameters of the report will appear, where you can configure the entity, period, filters, options and format of the report.
For details about how to configure these parameters, refer to the relevant page(s) in the list below:
Creating the report
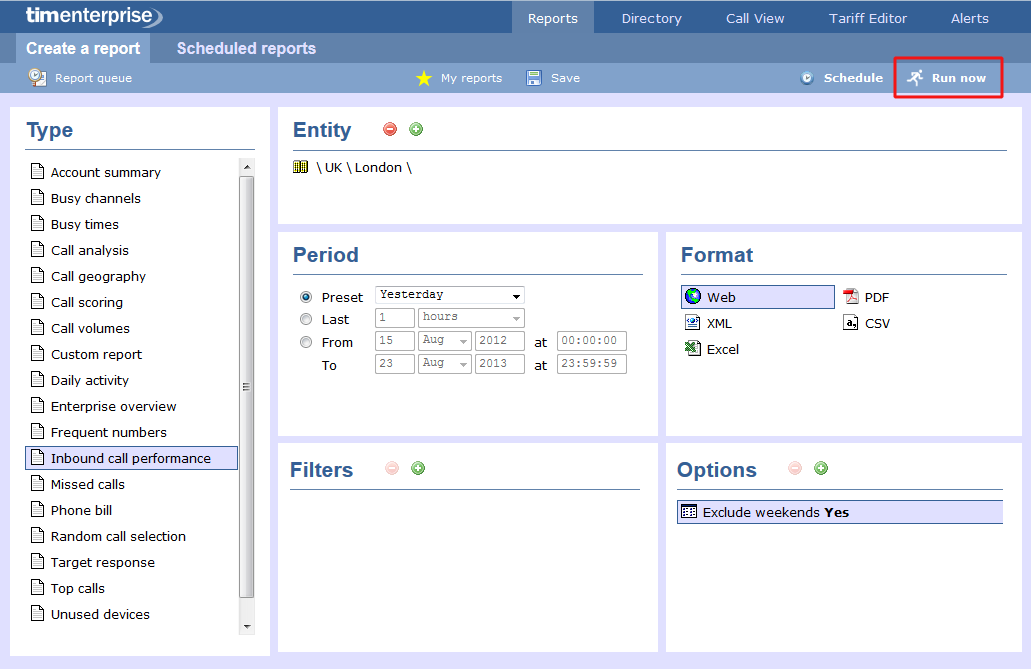
When you have configured the report's parameters, click on the button to run the report immediately; alternatively, you can save the report's definition or schedule the report for future delivery.
The report's results
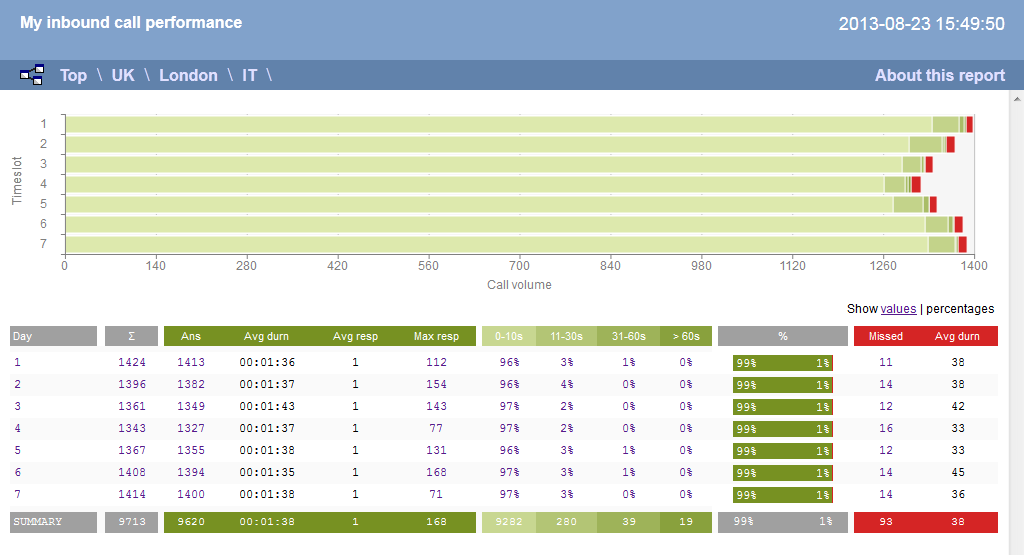
Below is an example of this report's output in Web format. By clicking on the About this report link at the top-right corner of the page, you can review any filters and options that have been applied to the report.
As with all reports produced by TIM Enterprise, each page of the report includes the following information:
- the report's title
- the date and time that the report was generated
- the name of the report, if applicable
The Web format is the most interactive of all formats: all column headers are click-sortable and most graphical and tabular elements can be drilled down into, allowing deeper analysis of your results.
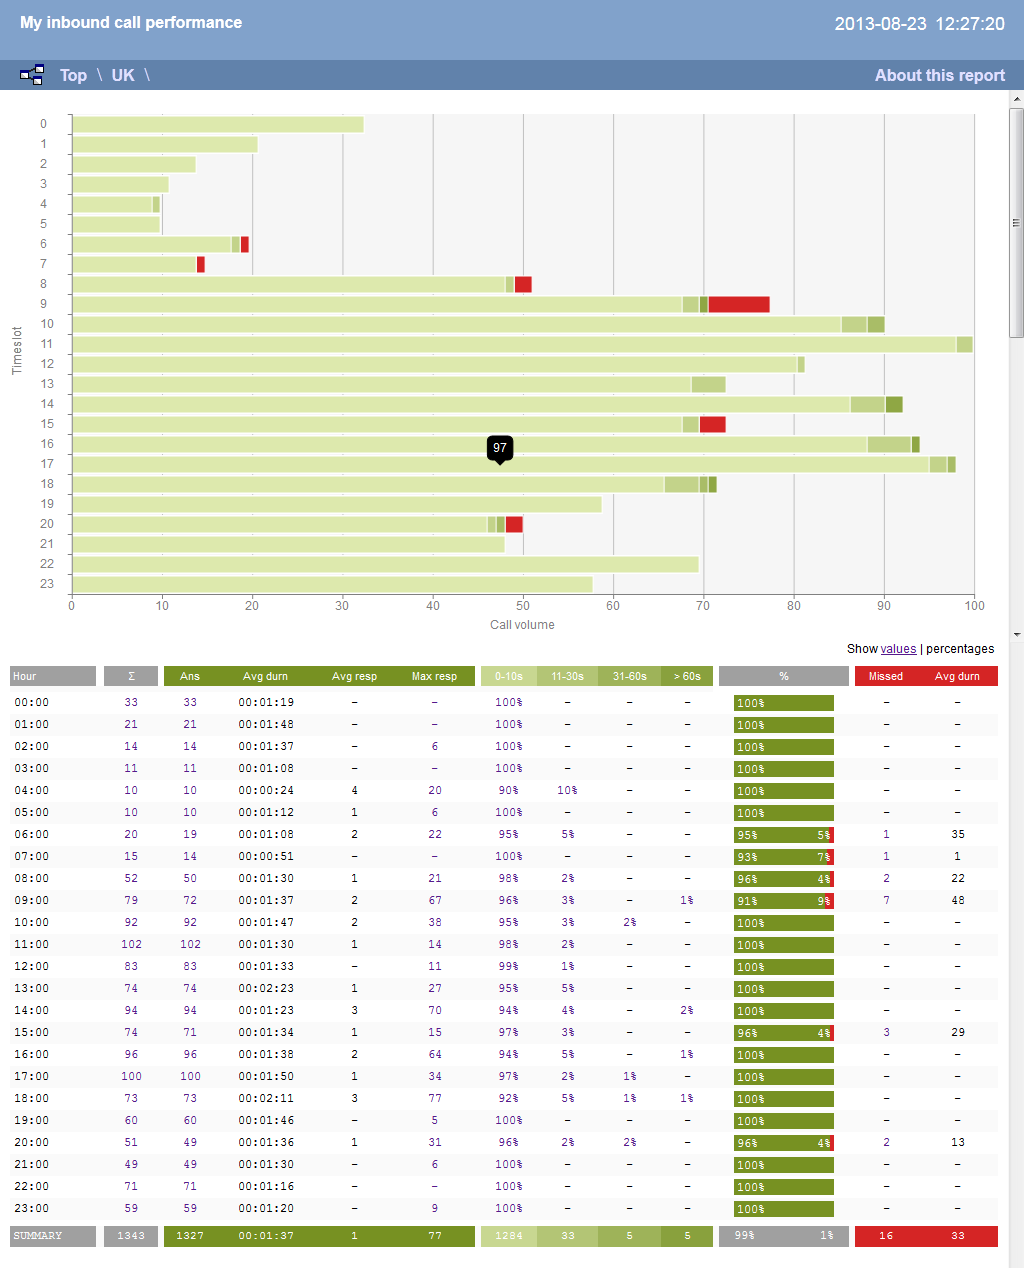
The achievement of each response time target is displayed as either percentages or actual values, and can be toggled using the link at the top-right of the graph.
The body of the report consists of a table showing a summary of your incoming calls, grouped by the period you selected. A description of the column headers are shown below:
| Header | Description |
|---|---|
| Hour / Day / Month / Year | The time period. |
 | The total number of calls in each period. |
Answered |
|
| % | The number of answered versus missed calls within each period, expressed as a percentage. |
Missed |
|
Each period is shown as a hyperlink which, if clicked on, re-runs the report using a more granular period.
To modify your report to cover a larger organisational scope, click on an element of the breadcrumb as shown below:
