Overview
The Call Scoring report provides a comprehensive analysis of previously-scored calls, enabling you to more efficiently assess the performance of your staff. TIM Enterprise gives you the option to create your own score cards, so you can specifically rate any call according to a set of custom evaluation criteria.
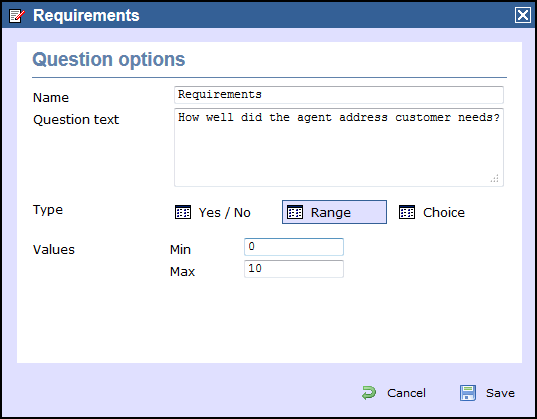
The scores can be based on any combination of questions whose answers are of the following type:
- Yes/No
- A value range
- Multiple choice
All questions are summarised in a clear, easy-to-understand format and are displayed separately, grouped into their respective categories.
An example of a scoring card can be seen below:
Running the report
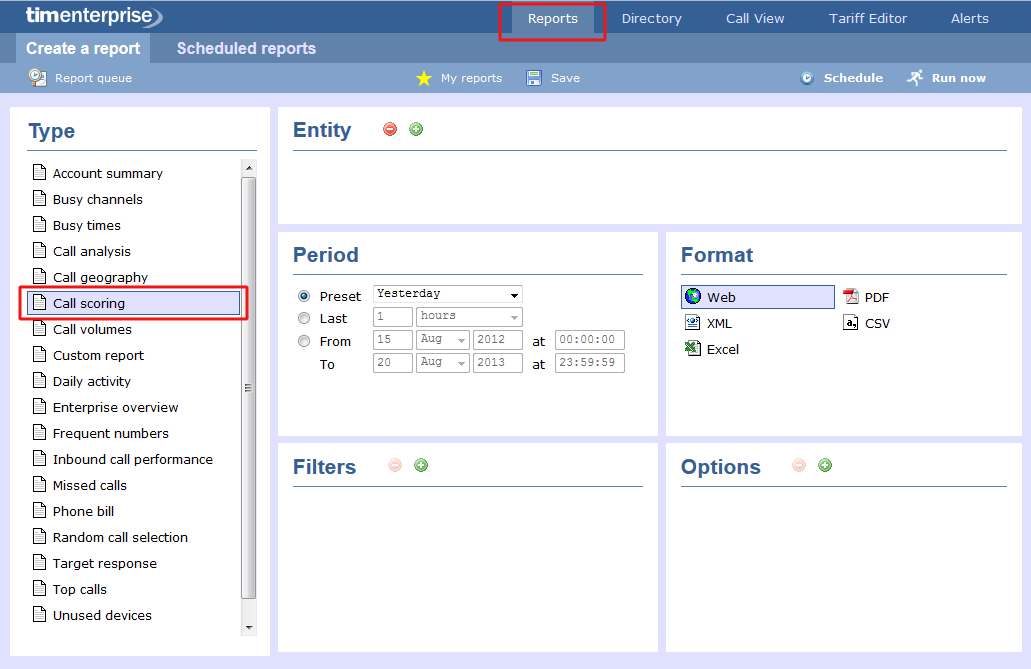
Click on the Reports tab and select Call scoring from the left-hand pane. The screen displaying the parameters of the report will appear, where you can configure the entity, period, filters, options and format of the report.
For details about how to configure these parameters, refer to the relevant page(s) in the list below:
Creating the report
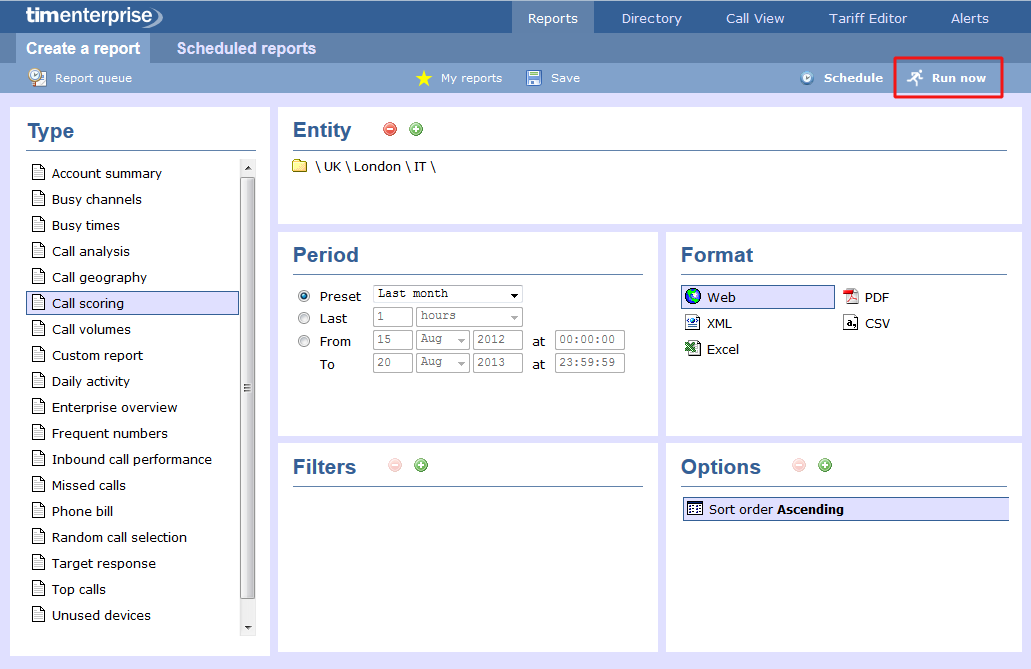
When you have configured the report's parameters, click on the button to run the report immediately; alternatively, you can save the report's definition or schedule the report for future delivery.
The report's results
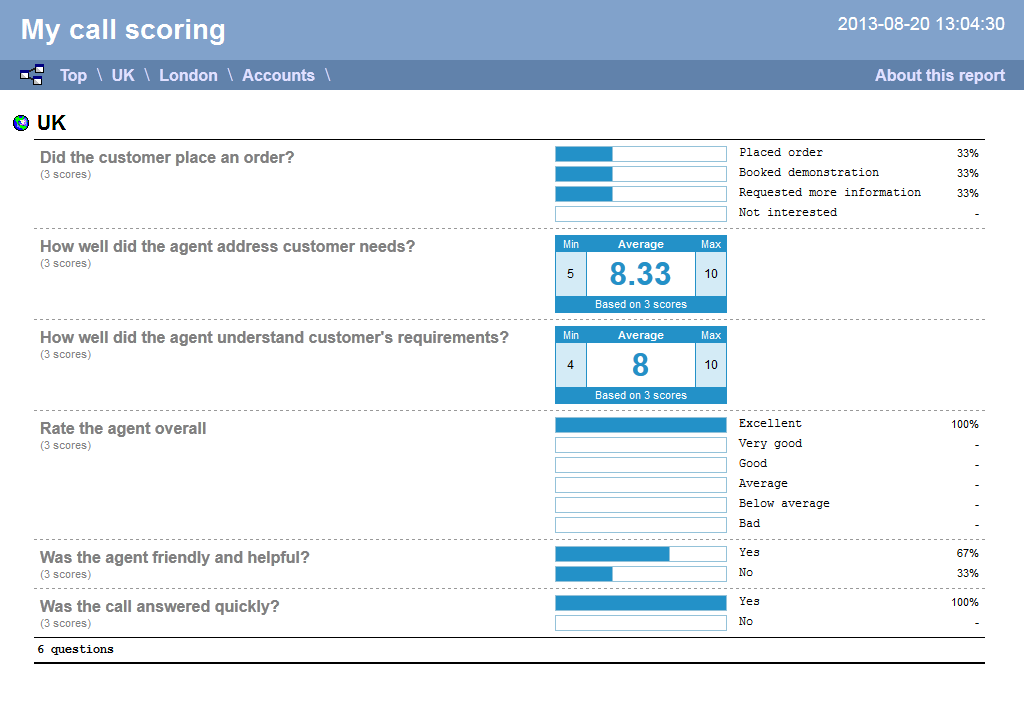
Below is an example of this report's output in Web format:
The Web format is the most interactive of all formats: all column headers are click-sortable and most graphical and tabular elements can be drilled down into, allowing deeper analysis of your results. By clicking on the About this report link at the top-right corner of the page, you can review any filters and options that have been applied to the report.
As with all reports produced by TIM Enterprise, each page of the report includes the following information:
- the report's title
- the date and time that the report was generated
- the name of the report, if applicable
Yes/No questions show their answers as two bars, each indicating the proportion of total answers.

Range questions show the minimum and maximum scores, as well as the average score.

Multiple choice questions show each possible answer as a percentage of the total number of answers.

To modify your report to cover a larger organisational scope, click on an element of the breadcrumb as shown below:
