Overview
The Busy Channels report allows you to break down each business day into half-hour periods, showing the maximum and average number of telephone lines in use for each half-hour period. This report is useful for determining whether or not you have enough lines or if you have too many.
Running the report
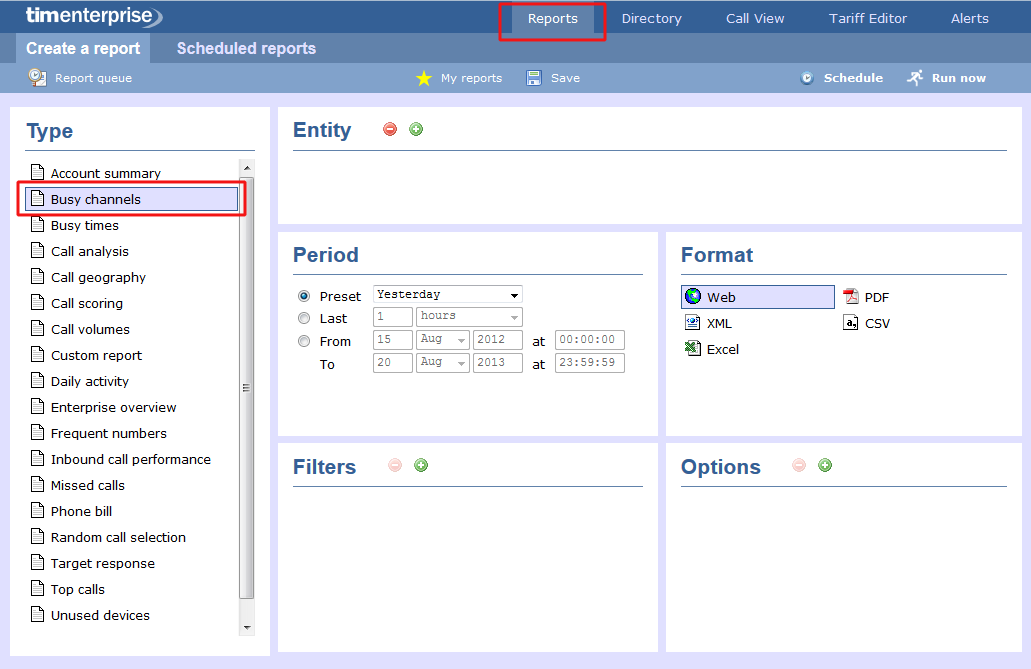
Click on the Reports tab and select Busy channels from the left-hand pane. The screen displaying the parameters of the report will appear, where you can configure the entity, period, filters, options and format of the report.
For details about how to configure these parameters, refer to the relevant page in the list below:
Creating the report
When you have configured the report's parameters, click on the button to run the report immediately; alternatively, you can save the report's definition or schedule the report for future delivery.

The report's results
Web format
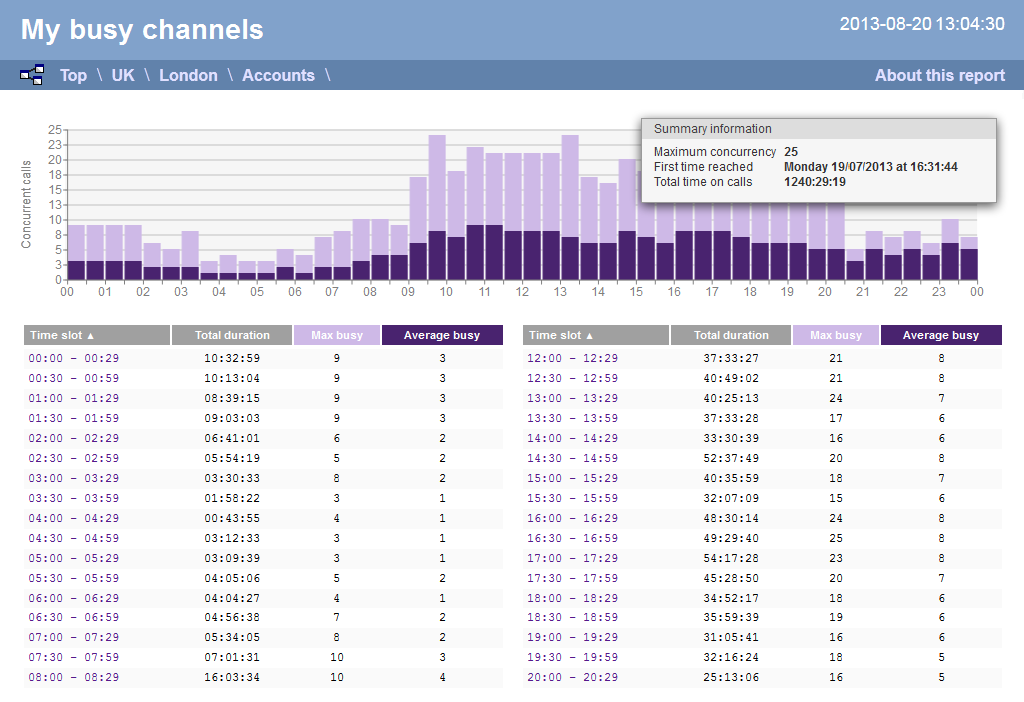
Below is an example of this report's output in Web format, displaying the activity of your telephone lines grouped in half-hour time slots:
The Web format is the most interactive of all formats: all column headers are click-sortable and most graphical and tabular elements can be drilled down into, allowing deeper analysis of your results. By clicking on the About this report link at the top-right corner of the page, you can review any filters and options that have been applied to the report.
As with all reports produced by TIM Enterprise, each page of the report includes the following information:
- the report's title
- the date and time that the report was generated
- the name of the report, if applicable
The body of the report consists of a graph and a table:
- The graph is a quick and easy indication of your line usage, broken down into half-hour time slots. The percentage on the y-axis shows the number of lines utilised, and the x-axis shows each half-hour of the day. The bars on the graph coloured light-purple show the maximum number of busy trunks in each particular half-hour, and the overlaid dark-purple ones show the average number of busy trunks within the same time period.
- The table displays the actual data organised in columns for maximum and average busy lines and the total duration for each half-hour time slot. Each column is described below:
| Header | Description |
|---|---|
| Time slot | The time of day in half-hour periods |
| Total duration | The total duration of all calls made or received within the time slot shown |
| Max busy | The maximum number of trunks in use during the time slot shown |
| Average busy | The average number of trunks in use during the time slot shown |
All column headers are clickable, allowing you to dynamically reorder the results. |
To modify your report to cover a larger organisational scope, click on an element of the breadcrumb as shown below:

PDF format
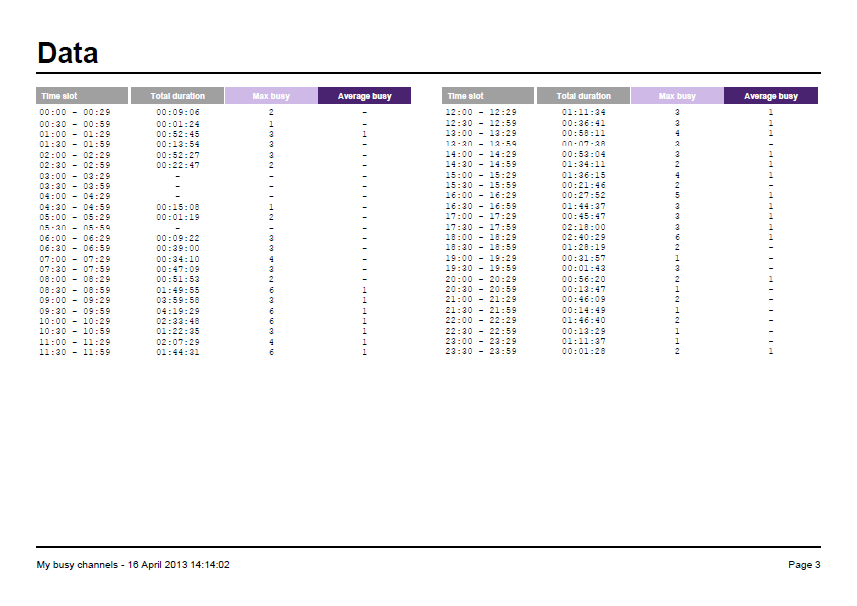
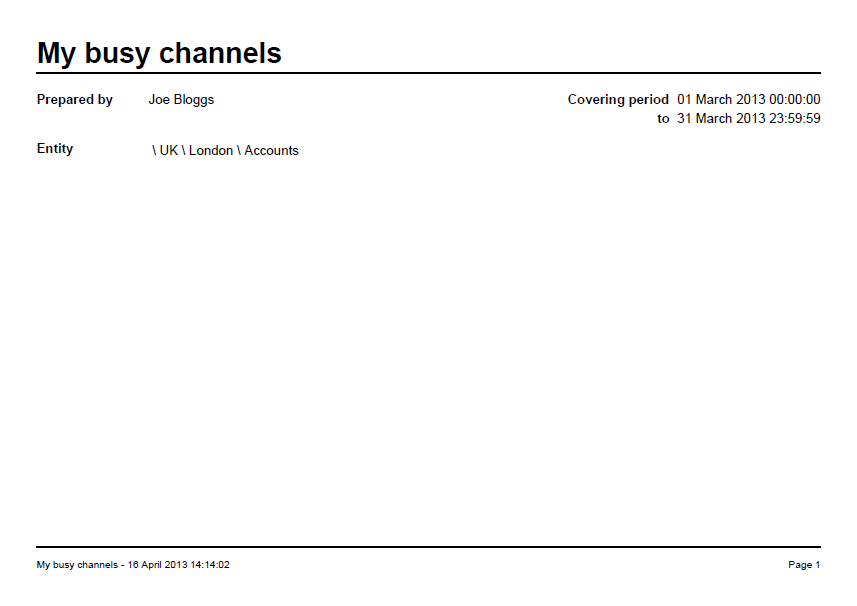
If you chose to run the report in PDF format, the report will consist of three pages.
The first page shows the login name of the person who has prepared/scheduled the report, the entity you are reporting on, the period covered and any filters used in the report.
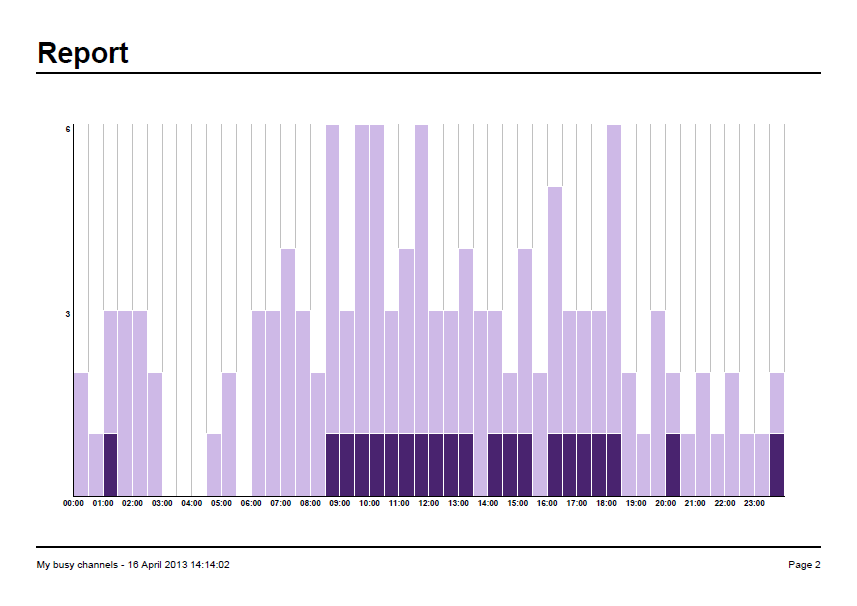
The second page has a graph depicting the average and maximum number of channels used, as shown below:
The third page contains a table of time slots, showing the maximum and average number of channels that were busy, along with the total duration of time spent on calls during each time slot.